You’ll need the GoVeda MCP server connected first. It takes about a minute. See Connect to Claude or ChatGPT to set it up. Once it’s connected, just ask your question; your assistant reaches for GoVeda on its own when a patent task needs it. New accounts get a 14-day free trial with 10,000 credits.
Who leads in a technology area, and how did the race get there? Name the competitors and the technology, and your assistant counts each one’s patents from real data and charts them side by side across the years, so you see the whole arc instead of a single snapshot.
The prompt
Open a new chat and paste:
Compare Qualcomm, Huawei, and Ericsson in 5G over time. Resolve each company to its exact assignee name, then fix one consistent 5G proxy classification (CPC H04W, wireless communication networks). For each filing year from 2010 to today, count each company’s patents filed that year in that classification, and chart all three as a grouped bar chart by filing year in an artifact, one color per company. Finish with a three-line read: where each company peaks, who leads when, and flag that the most recent two years are undercounted by patent publication lag, so the late drop is partly a data artifact, not a real collapse. Note these are publication counts, not deduplicated families.
What GoVeda does behind the scenes
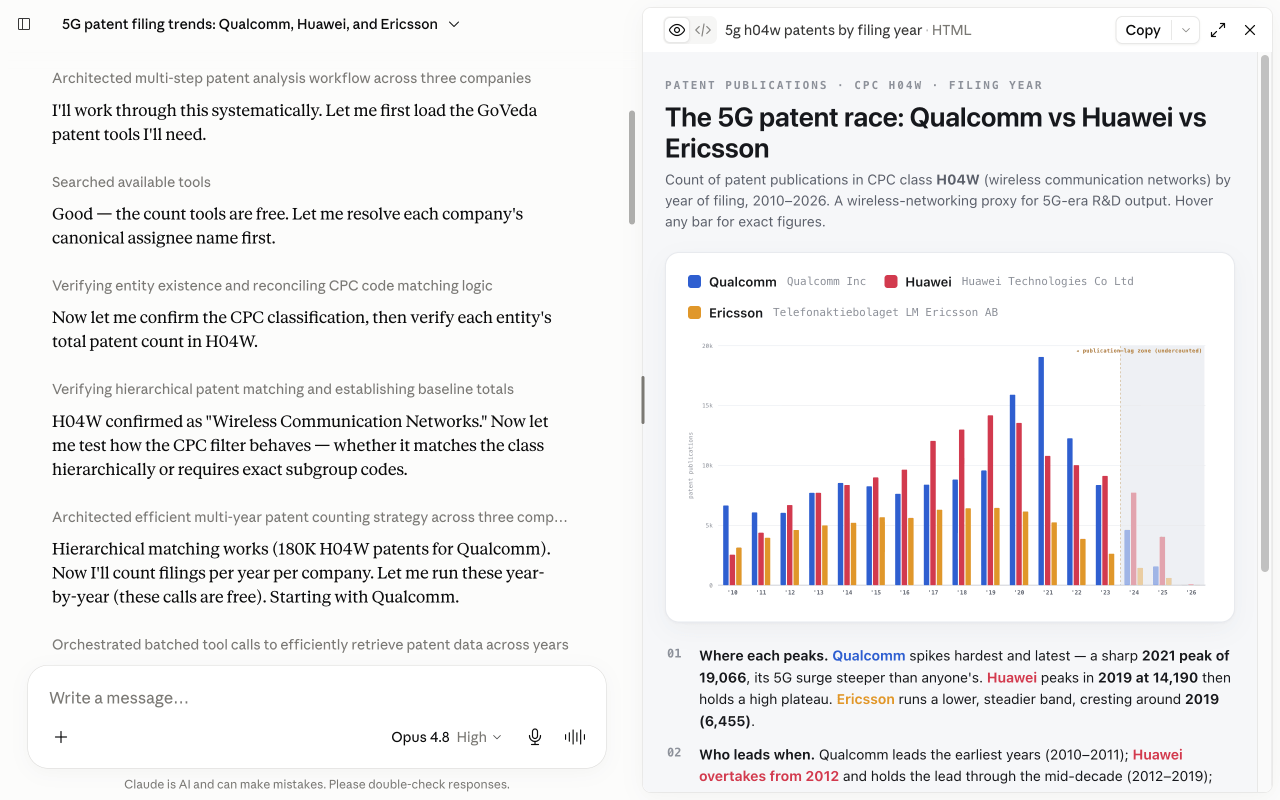
A fair comparison needs the same yardstick on every side, so the assistant resolves each company, fixes one classification, then counts:
Resolve each company
It calls lookup_party for Qualcomm, Huawei, and Ericsson to turn each name into the exact assignee stored on patent records, so a count captures the real entity rather than a near-miss spelling.
Pin down the classification
It uses lookup_classifications to settle on a CPC area that maps to 5G. There’s no single perfect code for “5G,” so the assistant picks a defensible proxy (here, H04W, wireless communication networks) and tells you which one it used, so every company is measured against the same bucket.
Count each portfolio
It runs party_count for the three companies, once per filing year from 2010 onward (a date filter on each call), so you get the full per-year trend rather than a single total.
Chart it
It renders the counts as a grouped bar chart by filing year in an artifact, one color per company. You get a visual you can drop into a deck, backed by real numbers rather than a guess.
You can watch the whole chain happen in the chat:
What you get
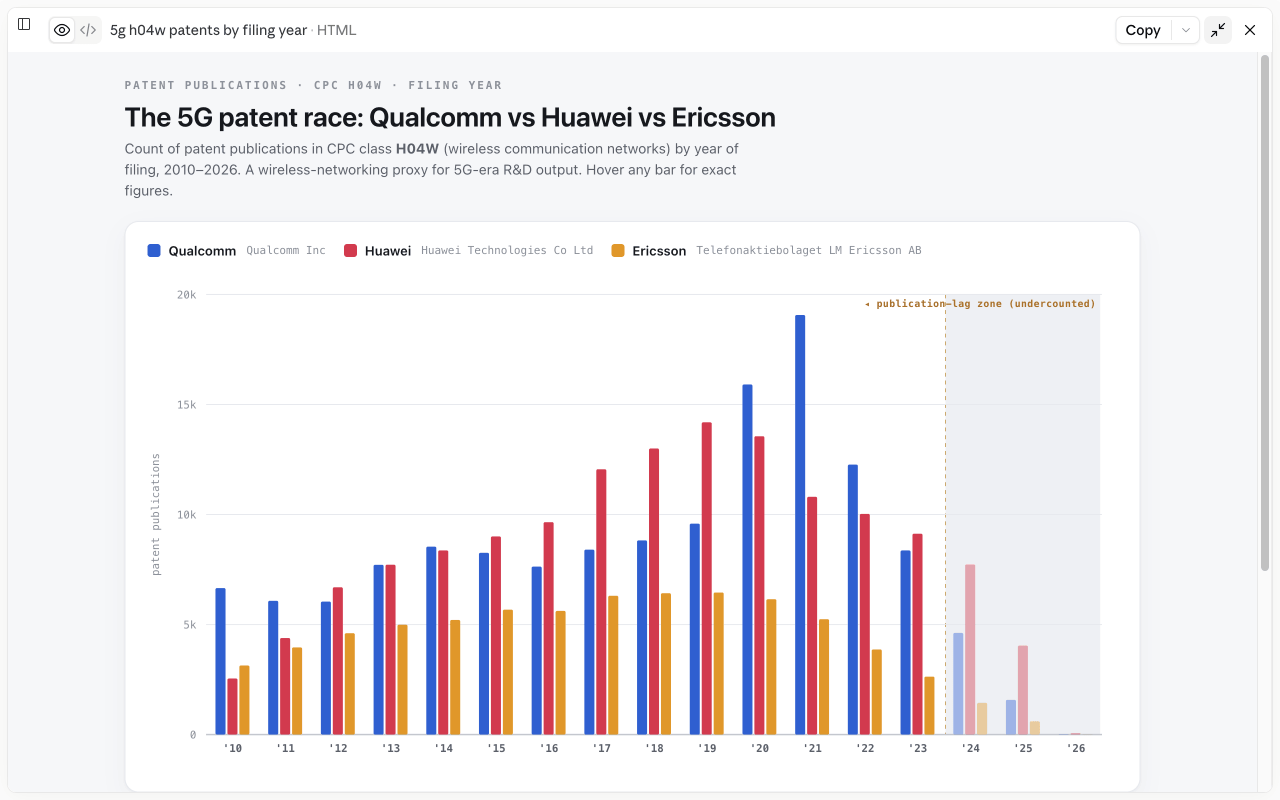
You get a grouped bar chart that runs from 2010 to today, with each company’s filings side by side year by year. The shape tells the story: the field climbs through the 2010s, peaks around 2019 to 2021 as 5G standardization lands, then tapers. It stays honest about method: the counts are publications, not deduplicated families, and the most recent two years are undercounted because patents publish roughly 18 months after filing, so read the tail as incomplete rather than a cliff. The three-line read tells you who leads, when the lead changed hands, and why that late drop deserves the caveat.
Tips
Swap in any set of competitors and any technology area. The narrower the classification, the cleaner the comparison; a broad proxy like H04W mixes 4G, Wi-Fi, and 5G together, so ask the assistant to tighten it (say, to a specific 5G mechanism) when you need a sharper read. Index by filing year to see when the R&D happened, or by publication year for a more complete recent tail. To map one company’s whole portfolio by technology instead, see Map a Portfolio by Technology; to explore a single company’s footprint, see Explore a Company’s Patents.
Next: browse more use cases or read the MCP tool reference.